【Chart.js】レーダーチャートでデータ線以外の要素を非表示にする
S.O.
プログラマ
はじめに
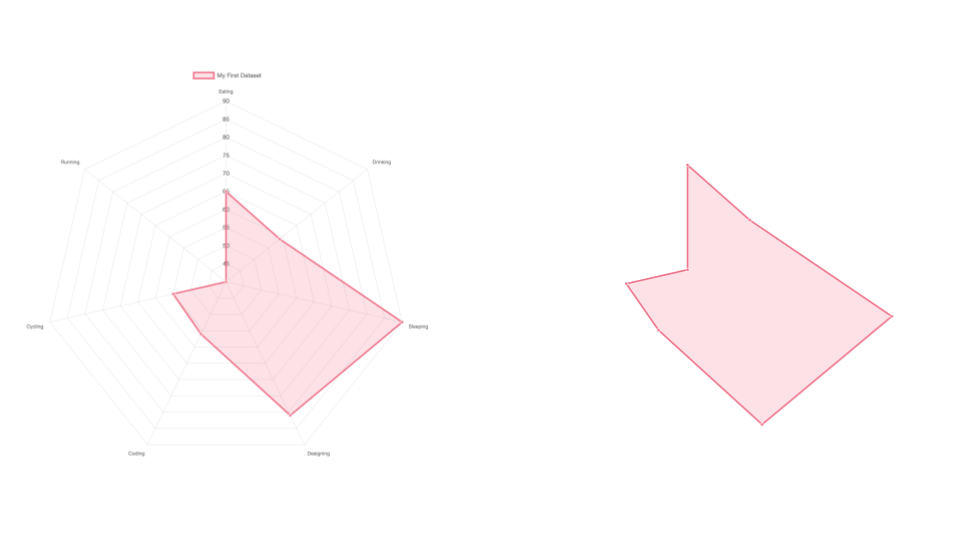
内容はタイトルそのままです
画像の上にデータ線を重ねて表示しようと思ったので、データ線以外を非表示にする方法を調べました
環境
- Chart.js@3.7.0
- バージョンが異なるとオプションの指定方法が変わることがあるので注意
ソースコード
適当なファイル(hoge.htmlとか)にコピペして、ブラウザで開けば動きます
<script src="https://cdn.jsdelivr.net/npm/chart.js@3.7.0/dist/chart.min.js"></script>

<div style="width: 800px;">
    <canvas id="myChart"></canvas>
</div>

<script>
    const ctx = document.getElementById('myChart').getContext('2d');
    const myChart = new Chart(ctx, {
        type: 'radar',
        data: {
            labels: [
                'Eating',
                'Drinking',
                'Sleeping',
                'Designing',
                'Coding',
                'Cycling',
                'Running'
            ],
            datasets: [{
                label: 'My First Dataset',
                data: [65, 59, 90, 81, 56, 55, 40],
                fill: true,
                backgroundColor: 'rgba(255, 99, 132, 0.2)',
                borderColor: 'rgb(255, 99, 132)',
                pointBackgroundColor: 'rgb(255, 99, 132)',
                pointBorderColor: '#fff',
                pointHoverBackgroundColor: '#fff',
                pointHoverBorderColor: 'rgb(255, 99, 132)'
            }]
        },
        options: {
            elements: {
                line: {
                    borderWidth: 3
                }
            },
            scales: {
                r: {
                    angleLines: {
                        display: false
                    },
                    grid: {
                        display: false
                    },
                    pointLabels: {
                        display: false
                    },
                    ticks: {
                        display: false
                    }
                }
            },
            plugins: {
                legend: {
                    display: false
                }
            }
        },
    });
</script>
解説
それぞれ、以下の要素に対応しています
angleLines:チャートの中心から各頂点に伸びてる直線
grid:チャートの中心から波紋状に広がっている線
pointLabels:各頂点のラベルテキスト
ticks:各目盛りのテキスト
legend:データの説明用テキスト
余談
調べていたら、Apache EChartsという別のライブラリを見つけたので、別の機会に試そうと思います
関連URL
- Chart.js
- 公式サイト:https://www.chartjs.org/
- レーダーチャートドキュメント:https://www.chartjs.org/docs/latest/charts/radar.html
- Apache ECharts
S.O.
プログラマ